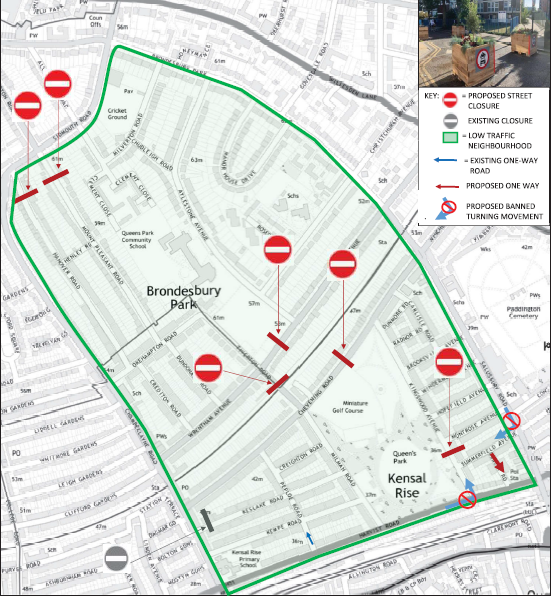
Brent Council is developing network of Healthy Neighbourhoods across the borough as part of their work to reduce the negative impact of traffic and air pollution. They are part of the wider strategy to improve the health of our communities.
The Healthy Neighbourhood schemes propose to limit vehicle access in a number of residential roads and limit the growing problem of 'rat running' enabled by satellite navigation systems. They encourage residents to adopt healthier, more active forms of transport and enable you to enjoy a quieter, safer community life.
The Healthy Neighbourhood schemes mean when you choose to walk or cycle you will find it easier and safer, with a greater number of routes less affected by traffic.
As part of the programme, we invited national charity, Living Streets, to lead on a period of community engagement from July to September 2021, allowing residents living in the Healthy Neighbourhood areas to express their views about how they might be affected and to help shape the scheme.
There was an excellent response to the community engagement exercise.
The council will work collaboratively with the community to create healthy, liveable and safe streets. Any future proposals would be subject to funding being made available and further consultation.

Average number of motor vehicles per day
The table below shows the average number of motor vehicles per day on the named road before the trial and the throughout the 6 months.
| Road name | Before Trial | After 2 months | After 4 months | After 6 months |
|---|---|---|---|---|
| Hanover Road | 505 | | | |
| Mount Pleasant Road | 1353 | | | |
| Wrentham Avenue | 5629 | | | |
| Chevening Road | 1700 | | | |
| Kingwood Avenue | 2820 | | | |
| Tiverton Road (North of Chevening Road) | 5705 | | | |
| The Avenue (East of Tiverton Road) | 5703 | | | |
| Chamberlayne Road | 11390 | | | |
| Salusbury Road | 12090 | | | |
| Harvist Road | 3626 | | | |
Levels of NO2 concentrations (ug/m3)
| Road | Before trial* | After 2 months*** | After 4 months*** | After 6 months*** |
|---|---|---|---|---|
| Tiverton Road | 38.22* | | | |
| Salusbury Road | 49.59* | | | |
| Chamberlayne road | 41.97* | | | |
| Salusbury Rd/ Junction with Chevening Rd | 31.40** | | | |
| Harvist Road/ Salusbury Rd | 38.10** | | | |
| Harvist Road | 35.60** | | | |
| Queens Park Recreational area | 30.20** | | | |
| Chamberlayne Road (Ark Franklin Primary) | 41.00* | | | |
| Chamberlayne road | 67.50** | | | |
| Chevening road | 33.00* | | | |
| Wrentham Avenue | 34.60* | | | |
*Please note that these baseline figures are taken from the London Atmospheric Emissions Inventory 2016 which provides modelled annual mean concentrations for NO2 at a 20m grid resolution. 2016 is the most recent year for which this data is available for. If a location is situated between two points, an average has been taken.
**Measured baseline, annual mean for 2019
***Monthly concentrations are not yet adjusted in accordance to the LLAQM technical guidance and are therefore subject to change. Read more information about air quality data